
 The Interest Rate rises are now beginning to catch with the UK Property Market, the latest figures show.
Chris ‘Property Stato’ Watkin and this special guest Kristian Stott discuss the state of last week’s Property Market in this week’s UK Property Market Stats Show.
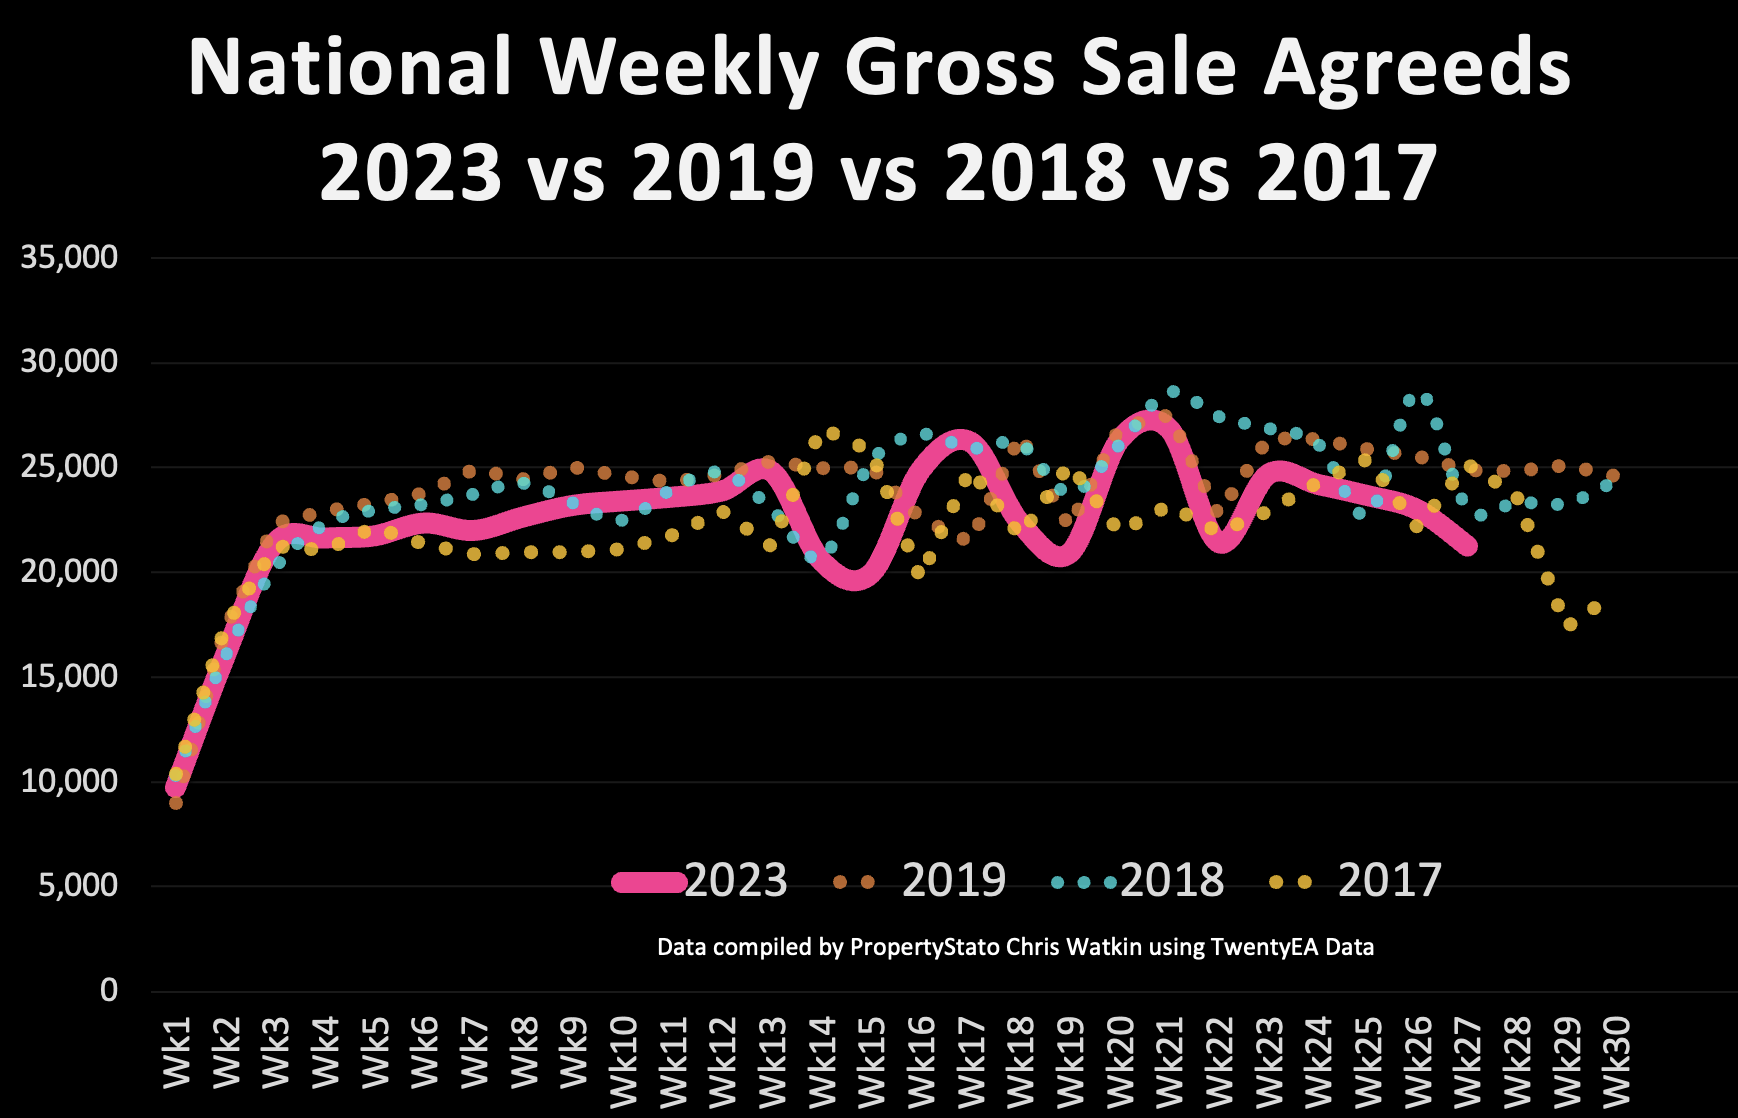
The average weekly UK net sales (gross sales less Fall Throughs) in April & May was 18,541. Two weeks ago it began its downward trajectory to 17,122 Net Sales, then 16,572 Net Sales last week and this week only 14,813 new sales.
This is due to Gross Sales being down, yet also sale fall throughs rising.
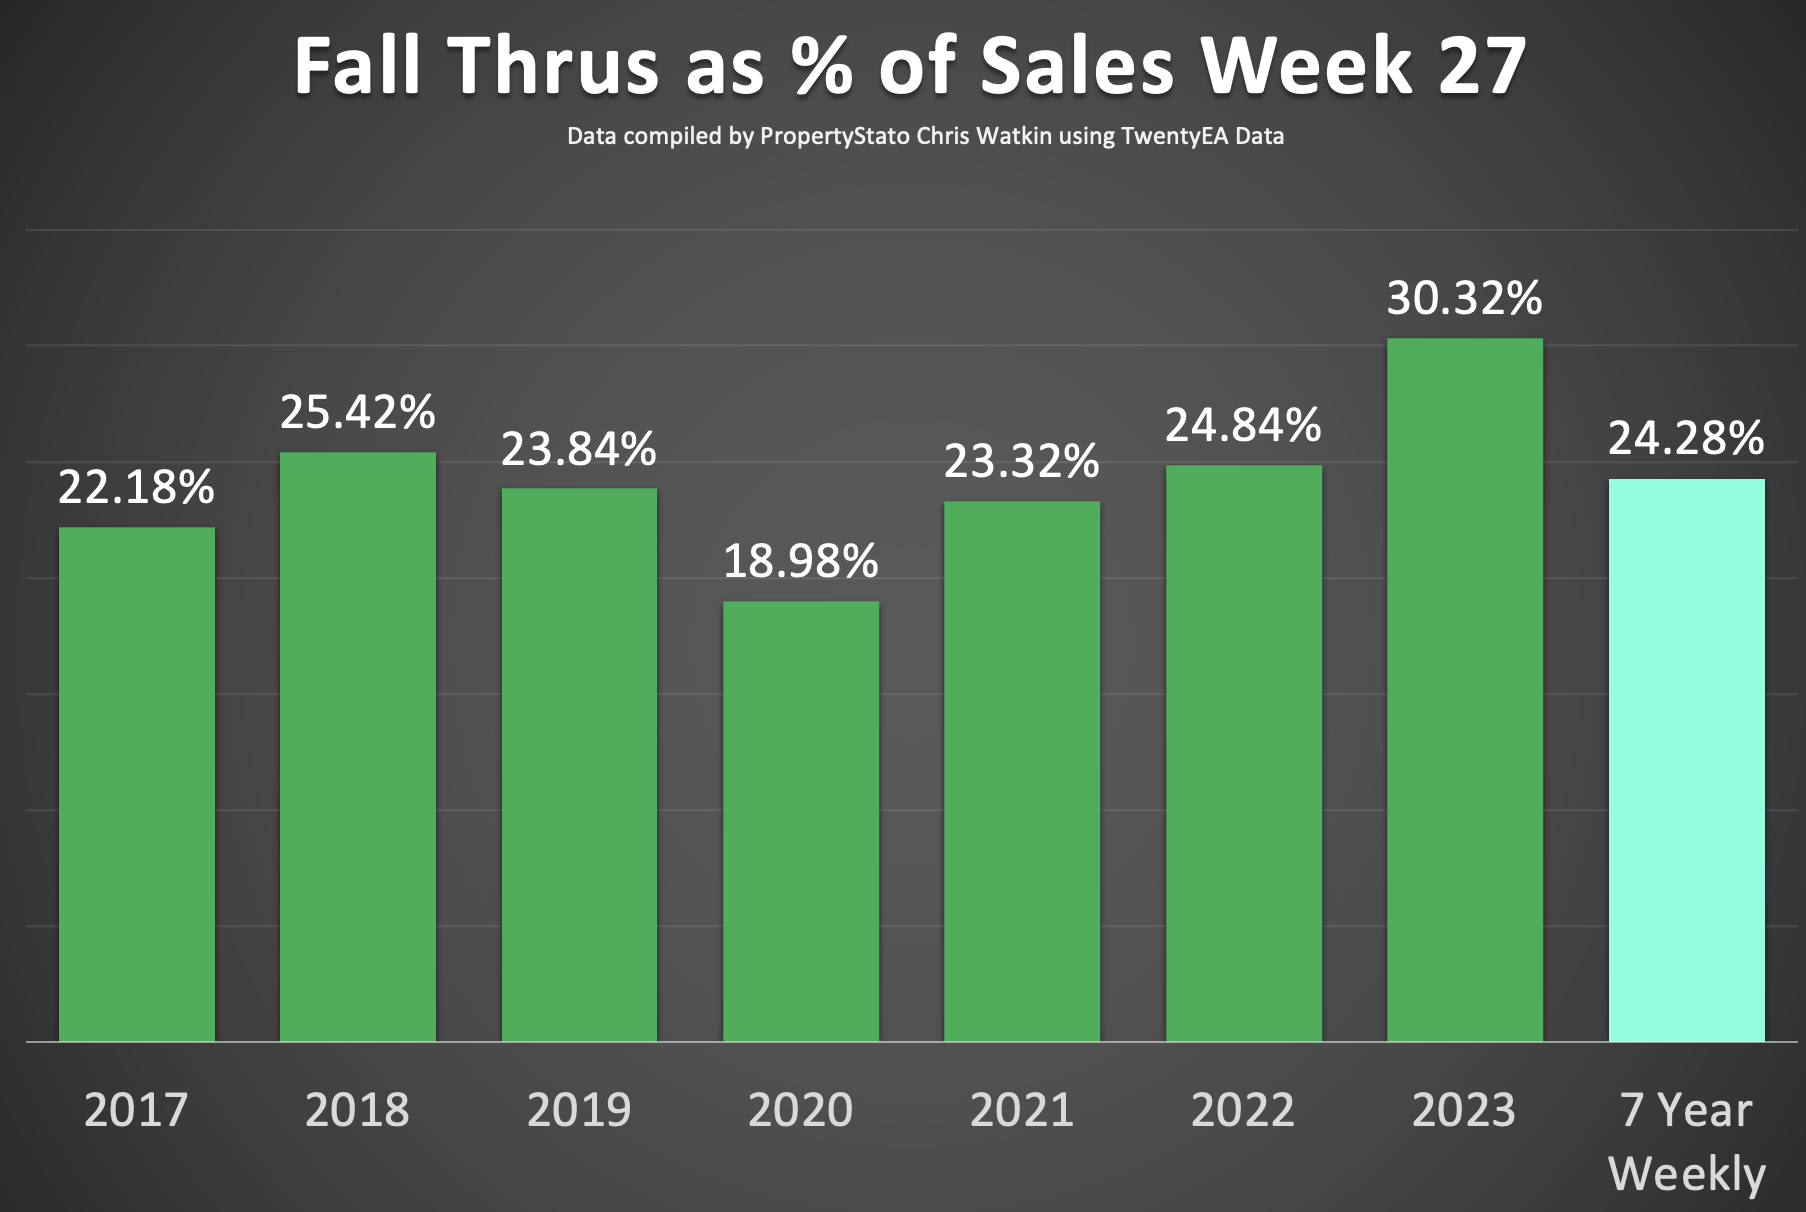
The sale fall through rate has continued to rise, with the current weekly rate at 30.32%, surpassing the 25% threshold for the fourth consecutive week.
While this sale fall through rate is not as high as the levels seen in Q4 2022 (when it averaged 38.7% per week), both Watkin and Stott stated it was important to monitor this upward trend closely.
Listings, price reductions, house sales agreed and price reductions are analysed both nationally and regionally in the UK Property Market Stats Show.
“Estate Agency bosses and their teams need to use this data to ensure they are advising their vendors correctly and secure the the right kind of stock to get the property sold and get paid for the hard job they do,” said Watkin.
The KPIs / Statistics of the UK Property Market for the week (Monday 3rd July to Sunday 9th July 2023 inclusive):
+ New properties to the market (Listings): 34,358 for the week. The 2023 running weekly average is 32,899.
+ Average Listing price: £431,614. The 2023 running weekly average is £434,222.
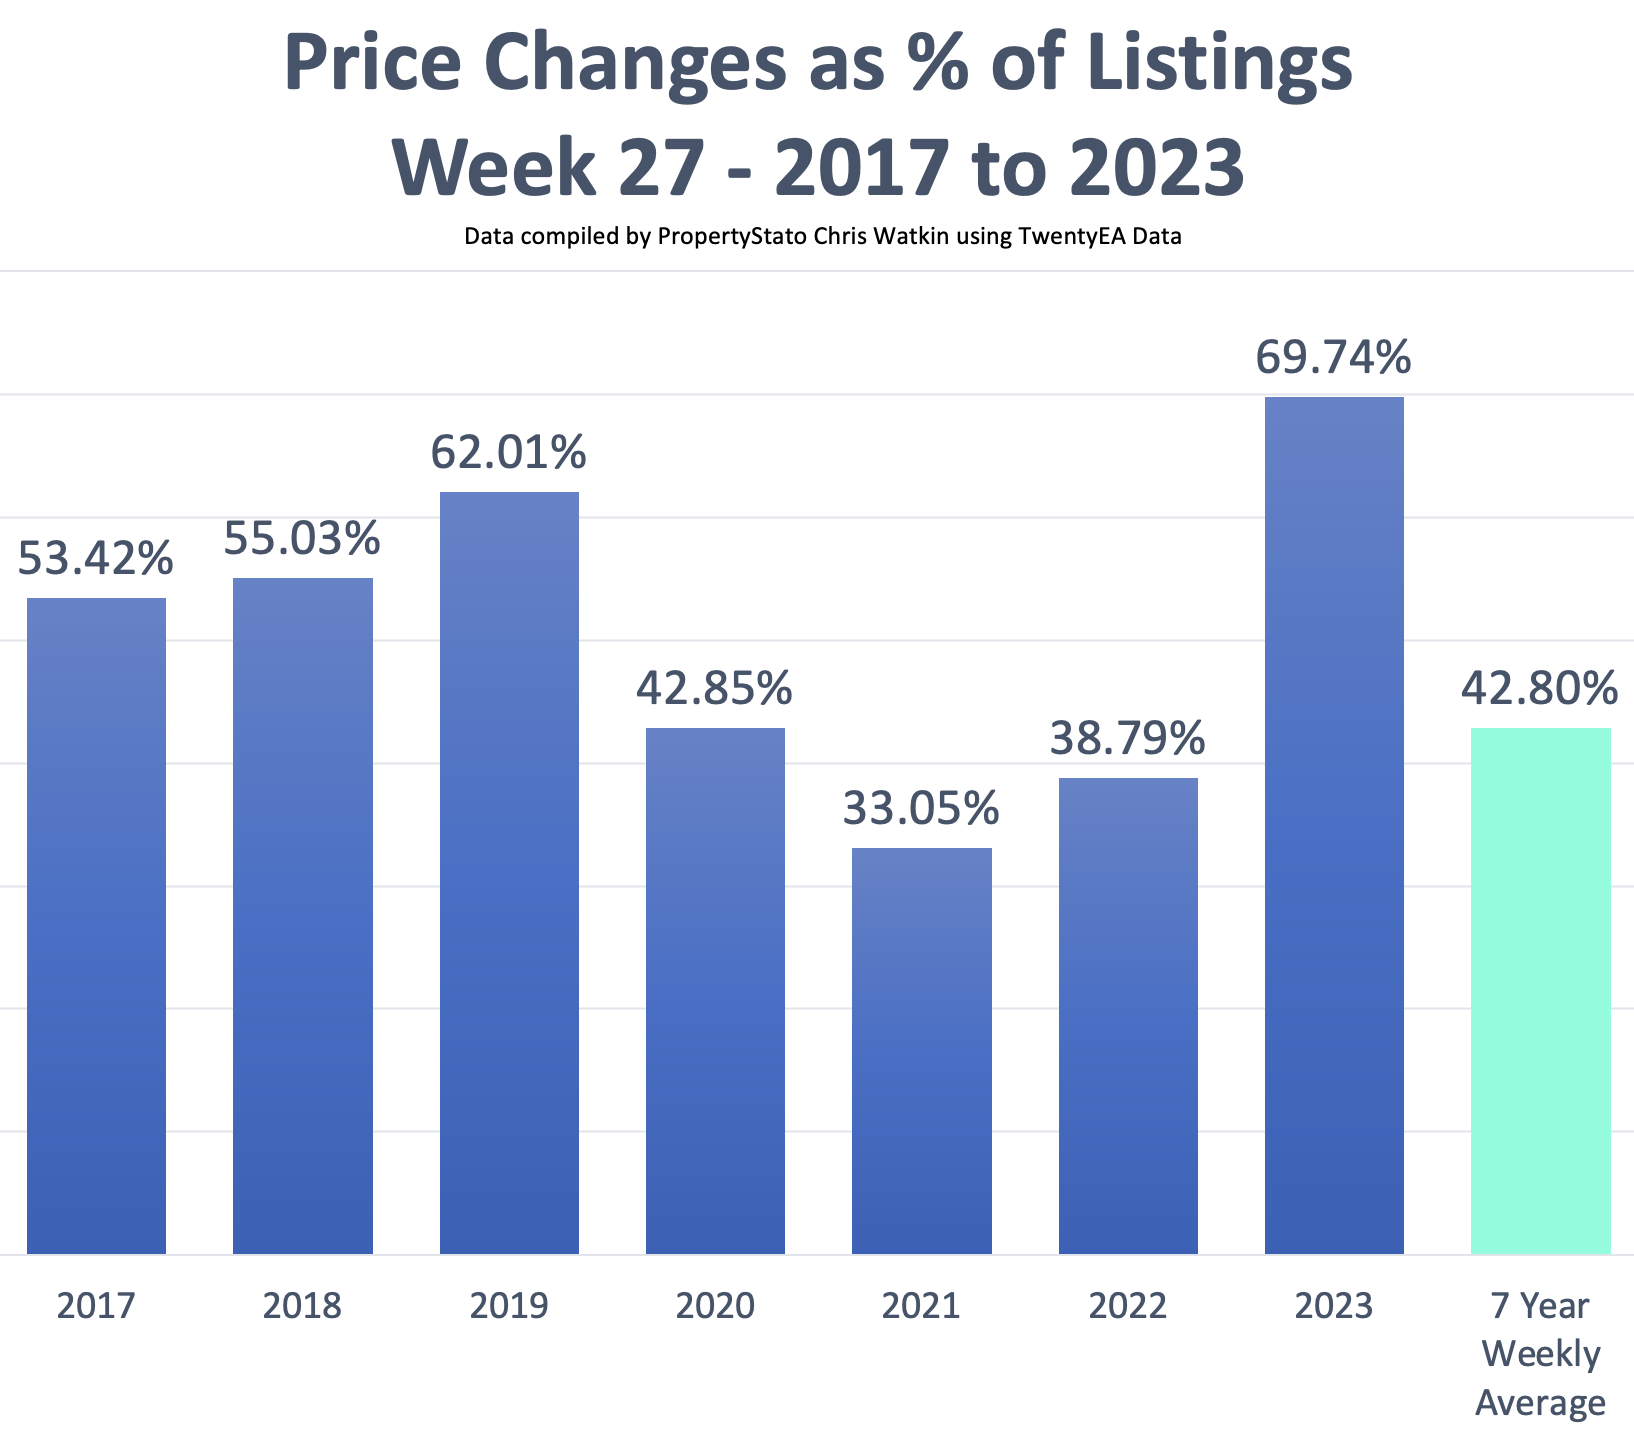
+ Price reductions: 23,961. The 2023 running weekly average is 18,945.
+ Average asking price of properties being reduced: £421,880. The 2023 running weekly average is £407,025.
+ Number of properties sold (gross sales): 21,258. The 2023 running weekly average is 22,328.
+ Average asking price of those properties that Sold STC this week: £363,348. The 2023 running weekly average is £359,694.
+ Sale fall throughs: 6,445. The 2023 running weekly average is 5,235.
+ Sale fall though rate. The number sales fall throughs expressed as a percentage of this week’s gross sales: 30.32% The 2023 running weekly average is 24.2%. (ie this week .. the number of sale fall thrus was 6,445 and the number sale agreed was 21,258. So, 6,445 expressed as a percentage of 21,258 is 30.32%)
At the end of the show, Watkin and Stott spent 15mins focusing on the Exeter property market


Regional % Sales Fallen Thru (this week vs YTD %)
INNER LONDON 33.48% against YTD average of 25.65%
OUTER LONDON 35.85% against YTD average of 28.14%
SOUTH EAST 34.07% against YTD average of 26.34%
SOUTH WEST 33.32% against YTD average of 25.56%
EAST OF ENGLAND 34.81% against YTD average of 26.62%
EAST MIDLANDS 27.89% against YTD average of 24.15%
WEST MIDLANDS 30.94% against YTD average of 25.06%
YORKSHIRE & HUMBER 27.29% against YTD average of 22.02%
NORTH EAST 26.30% against YTD average of 22.38%
NORTH WEST 32.41% against YTD average of 25.73%
WALES 30.22% against YTD average of 25.11%
SCOTLAND 13.93% against YTD average of 12.54%
You must be logged in to like or dislike this comments.
Click to login
Don't have an account? Click here to register